Understanding Your Analytics
Gain deep insights into your DBT practice with comprehensive analytics across time patterns, emotions, goals, and engagement.
What is the Analytics Dashboard?
The Analytics Dashboard transforms your practice data into actionable insights. Track patterns, identify trends, and understand what's working best for you across multiple dimensions of your DBT journey.
Accessing Analytics
- Navigate to the Skills tab at the bottom of the app
- Tap the Analytics button (chart icon) in the top toolbar
- The Analytics Dashboard will open with five different tabs to explore
Choosing Your Time Period
At the top of the Analytics Dashboard, you can select different time periods to analyze:
- Week: Last 7 days of practice
- Month: Last 30 days
- 3 Months: Quarterly view
- 6 Months: Half-year analysis
- Year: Annual overview
- All Time: Your complete practice history
Switch between periods to see how your practice evolves over different timeframes.
Analytics Tabs Explained
The Analytics Dashboard is organized into five comprehensive tabs:
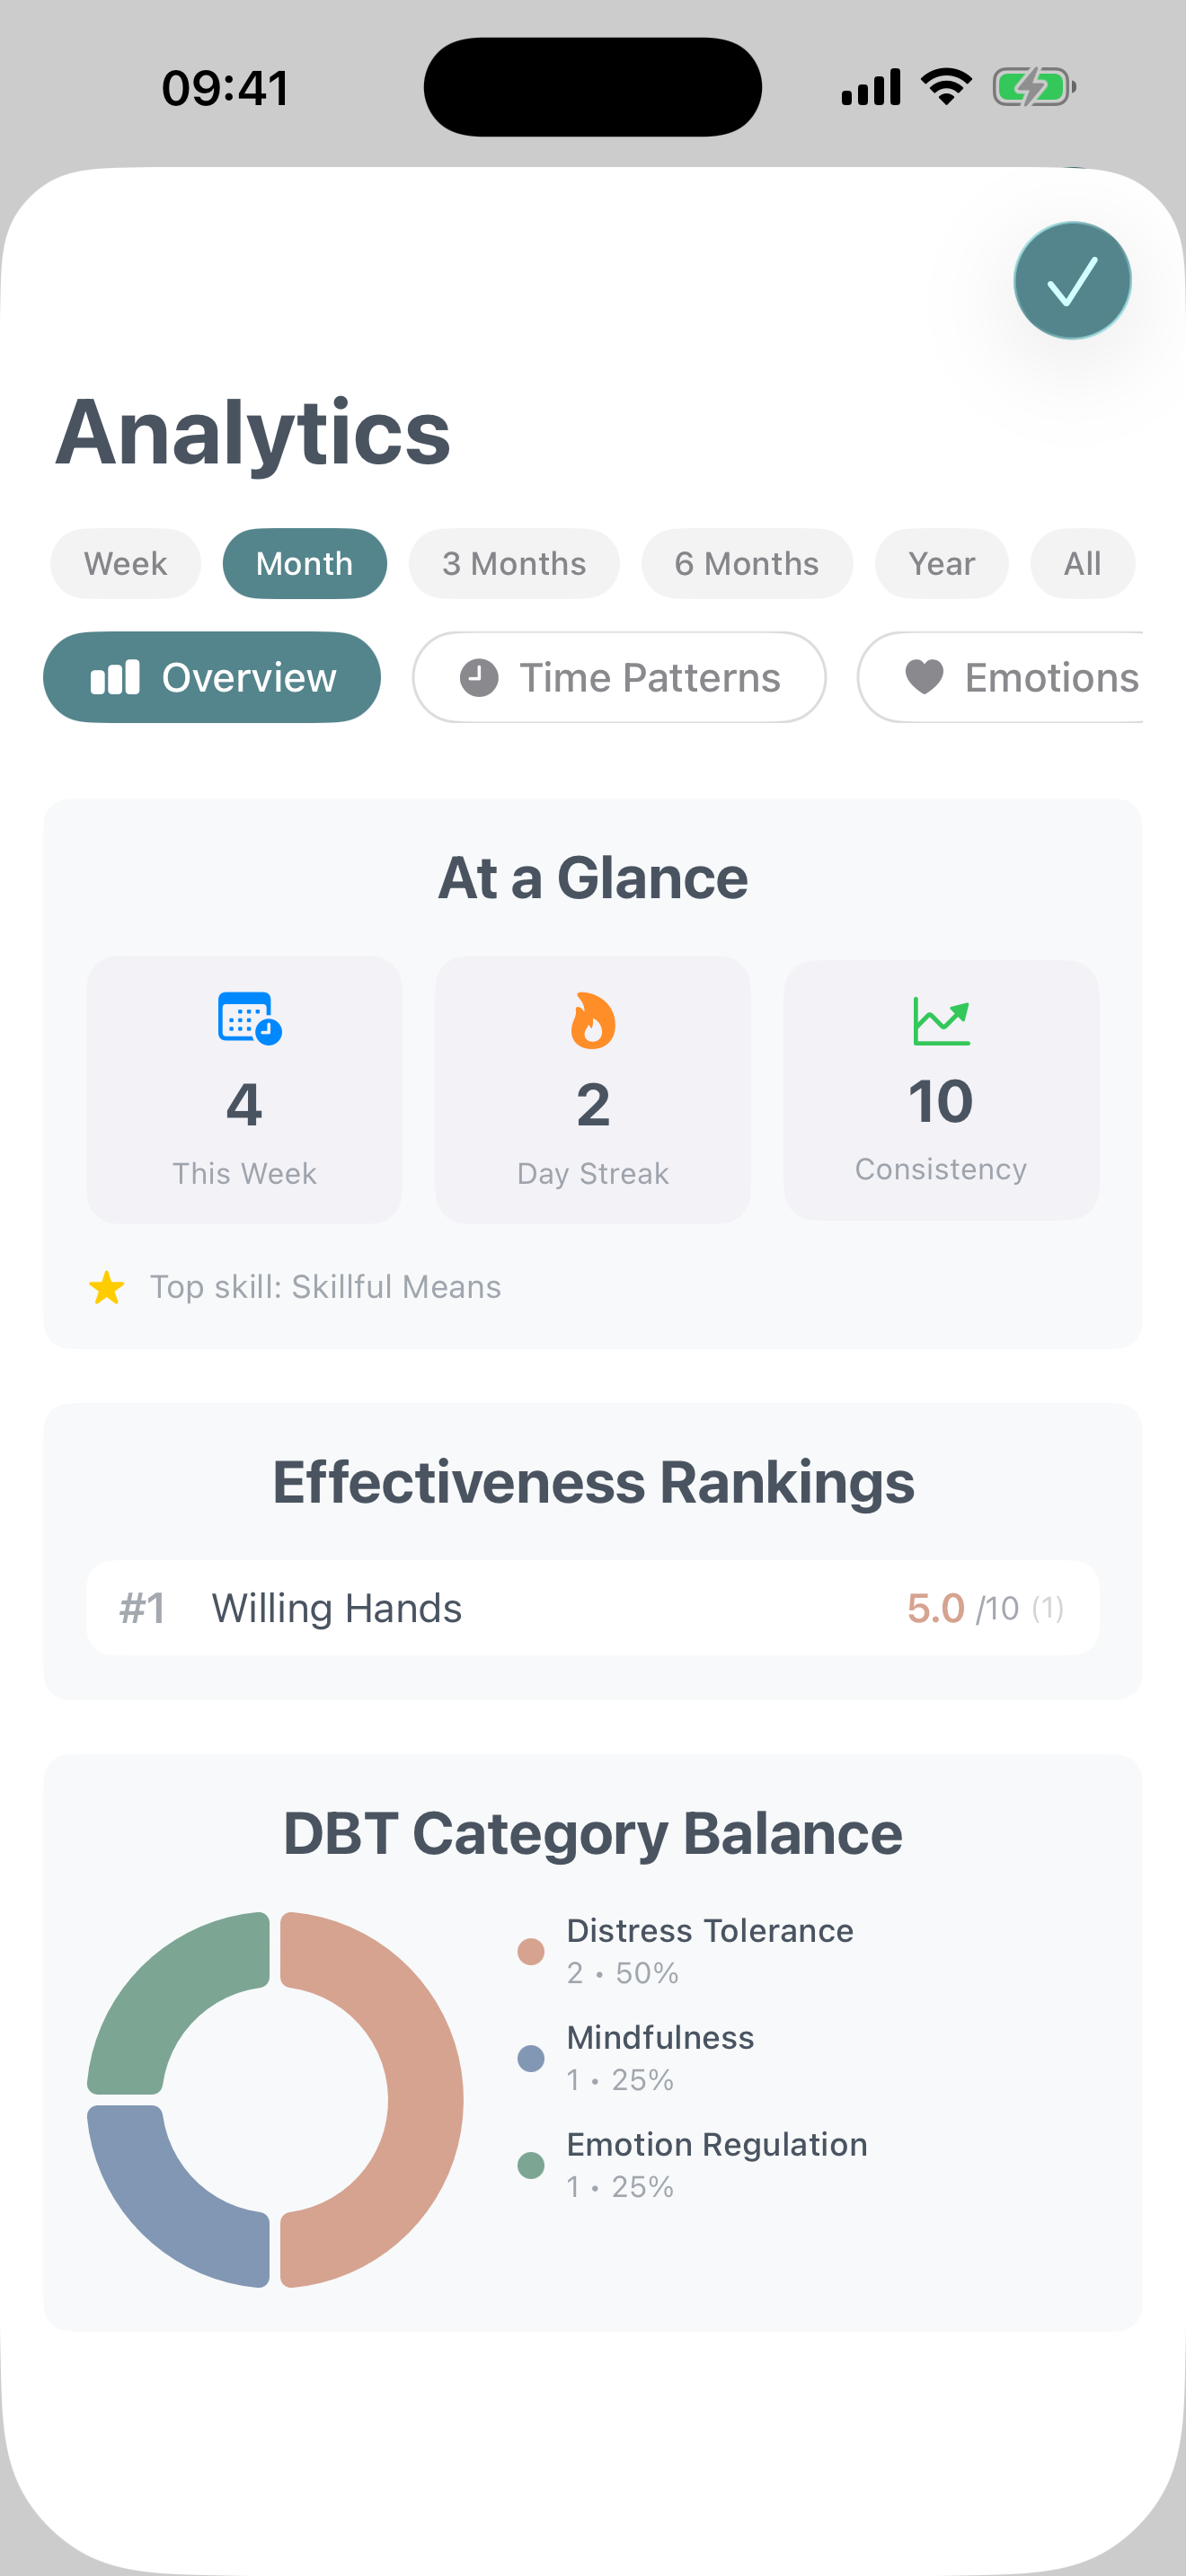
Overview
Your at-a-glance summary of practice performance.
- Quick Stats: See this week's activity, how it compares to last week, your current streak, and consistency score
- Effectiveness Leaderboard: Discover which skills you've rated as most effective based on your practice ratings
- Category Balance: Visualize how your practice is distributed across the four DBT modules (Mindfulness, Distress Tolerance, Emotion Regulation, Interpersonal Effectiveness)
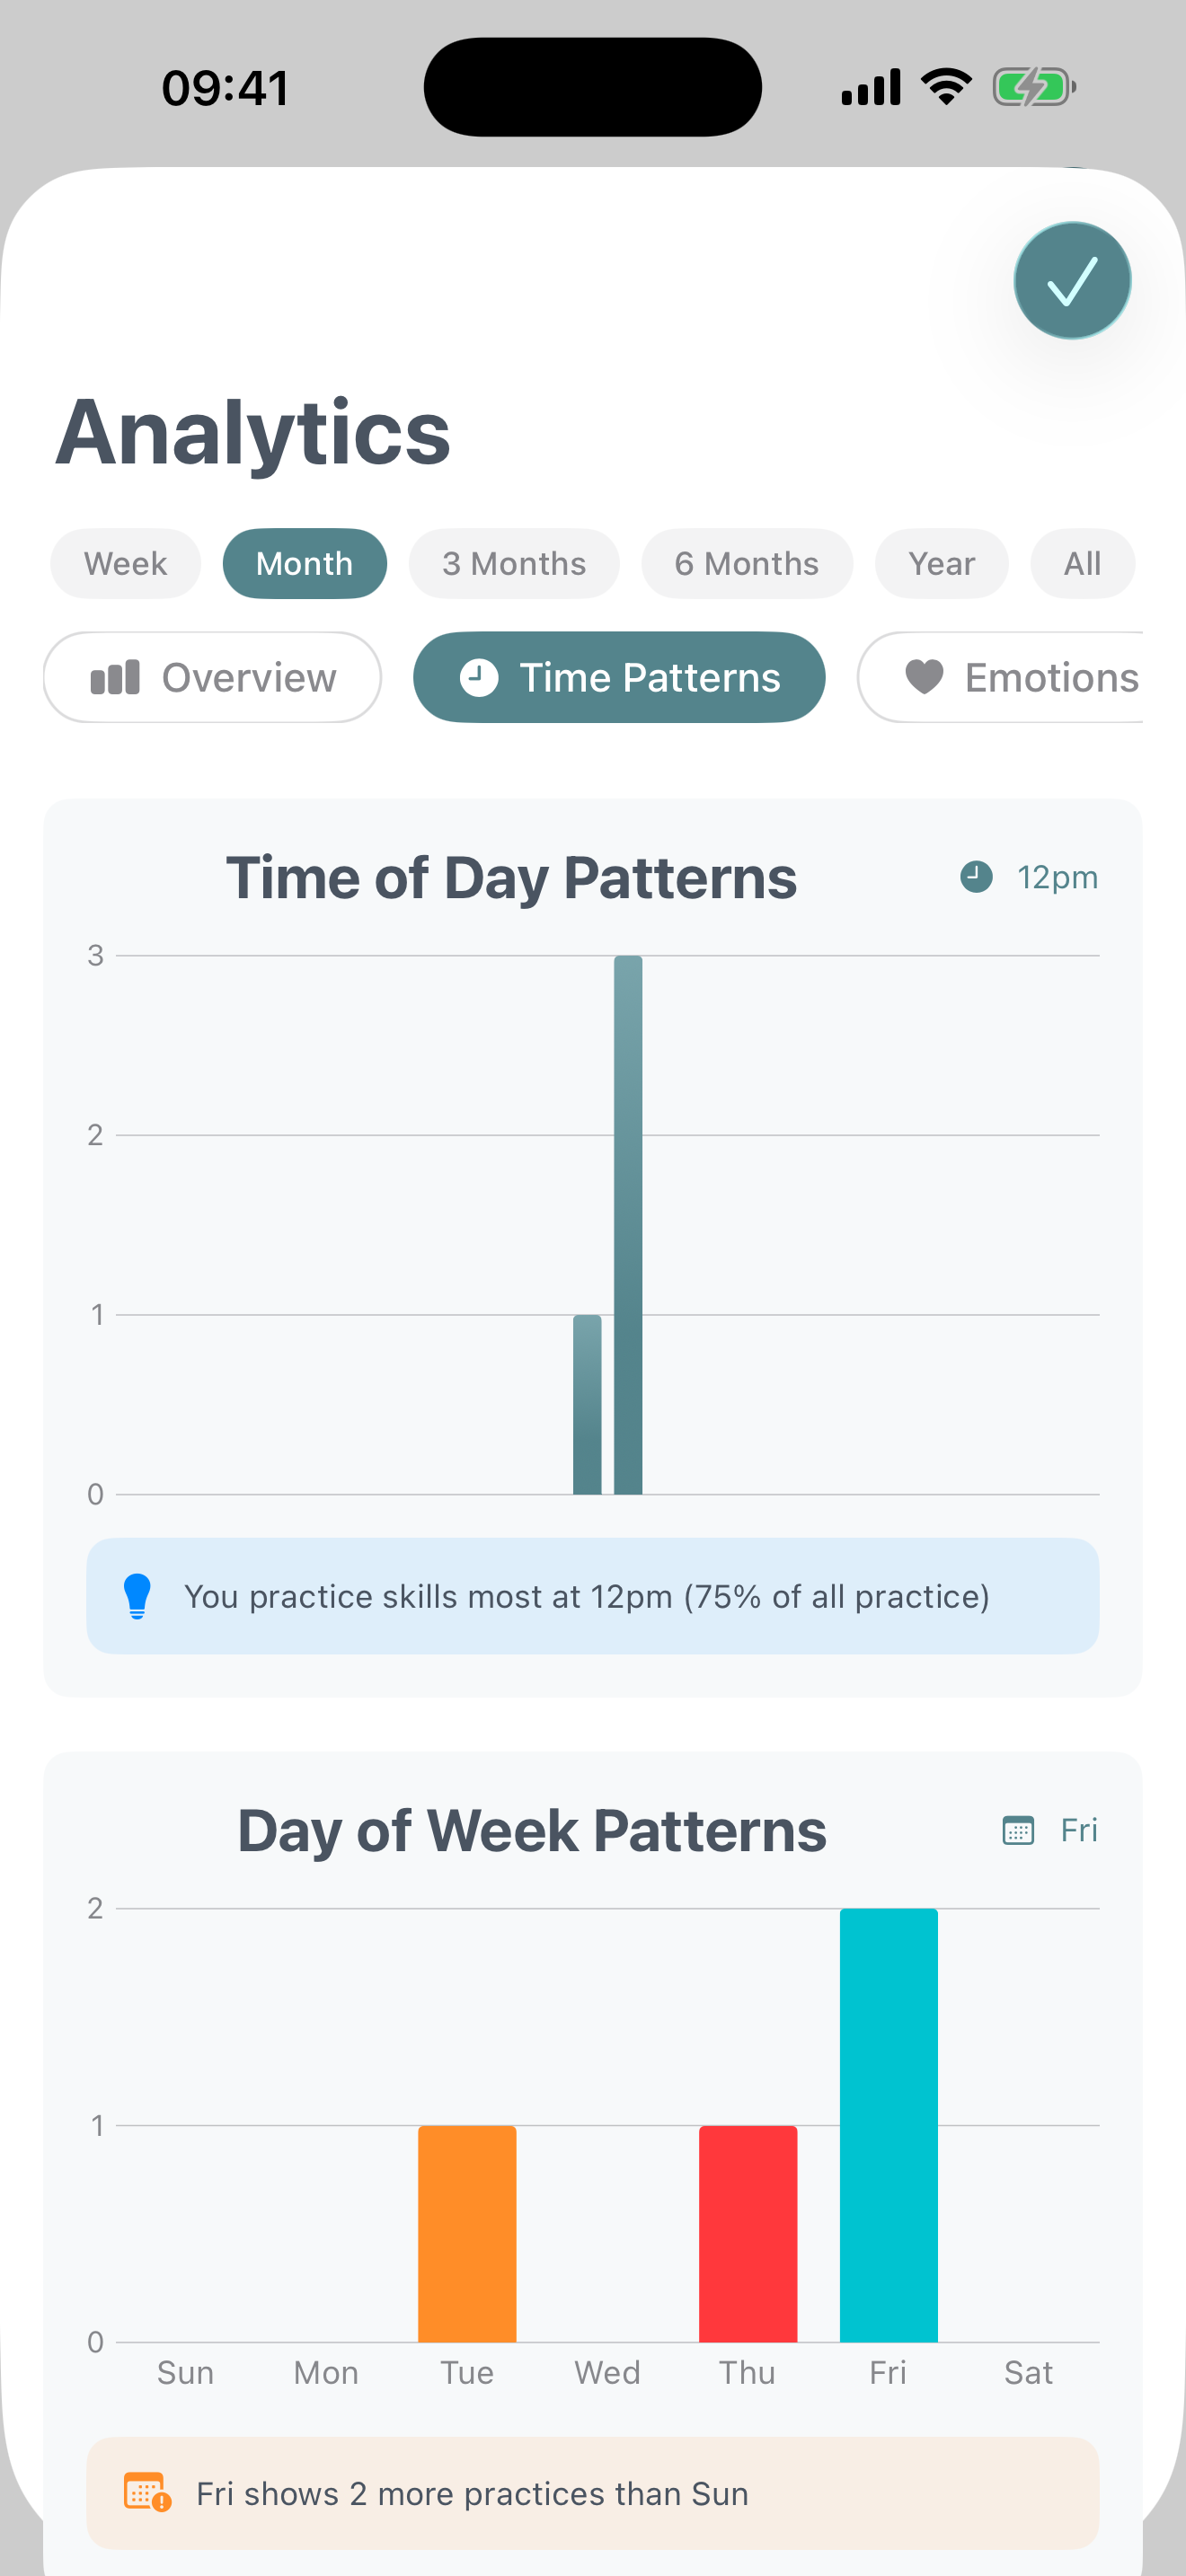
Time Patterns
Understand when you practice skills most effectively.
- Time of Day Heatmap: See which hours you're most active (morning, afternoon, evening, night)
- Day of Week Chart: Identify which days you practice most and least
- Monthly Trends: Track your practice volume over weeks and months to spot long-term patterns
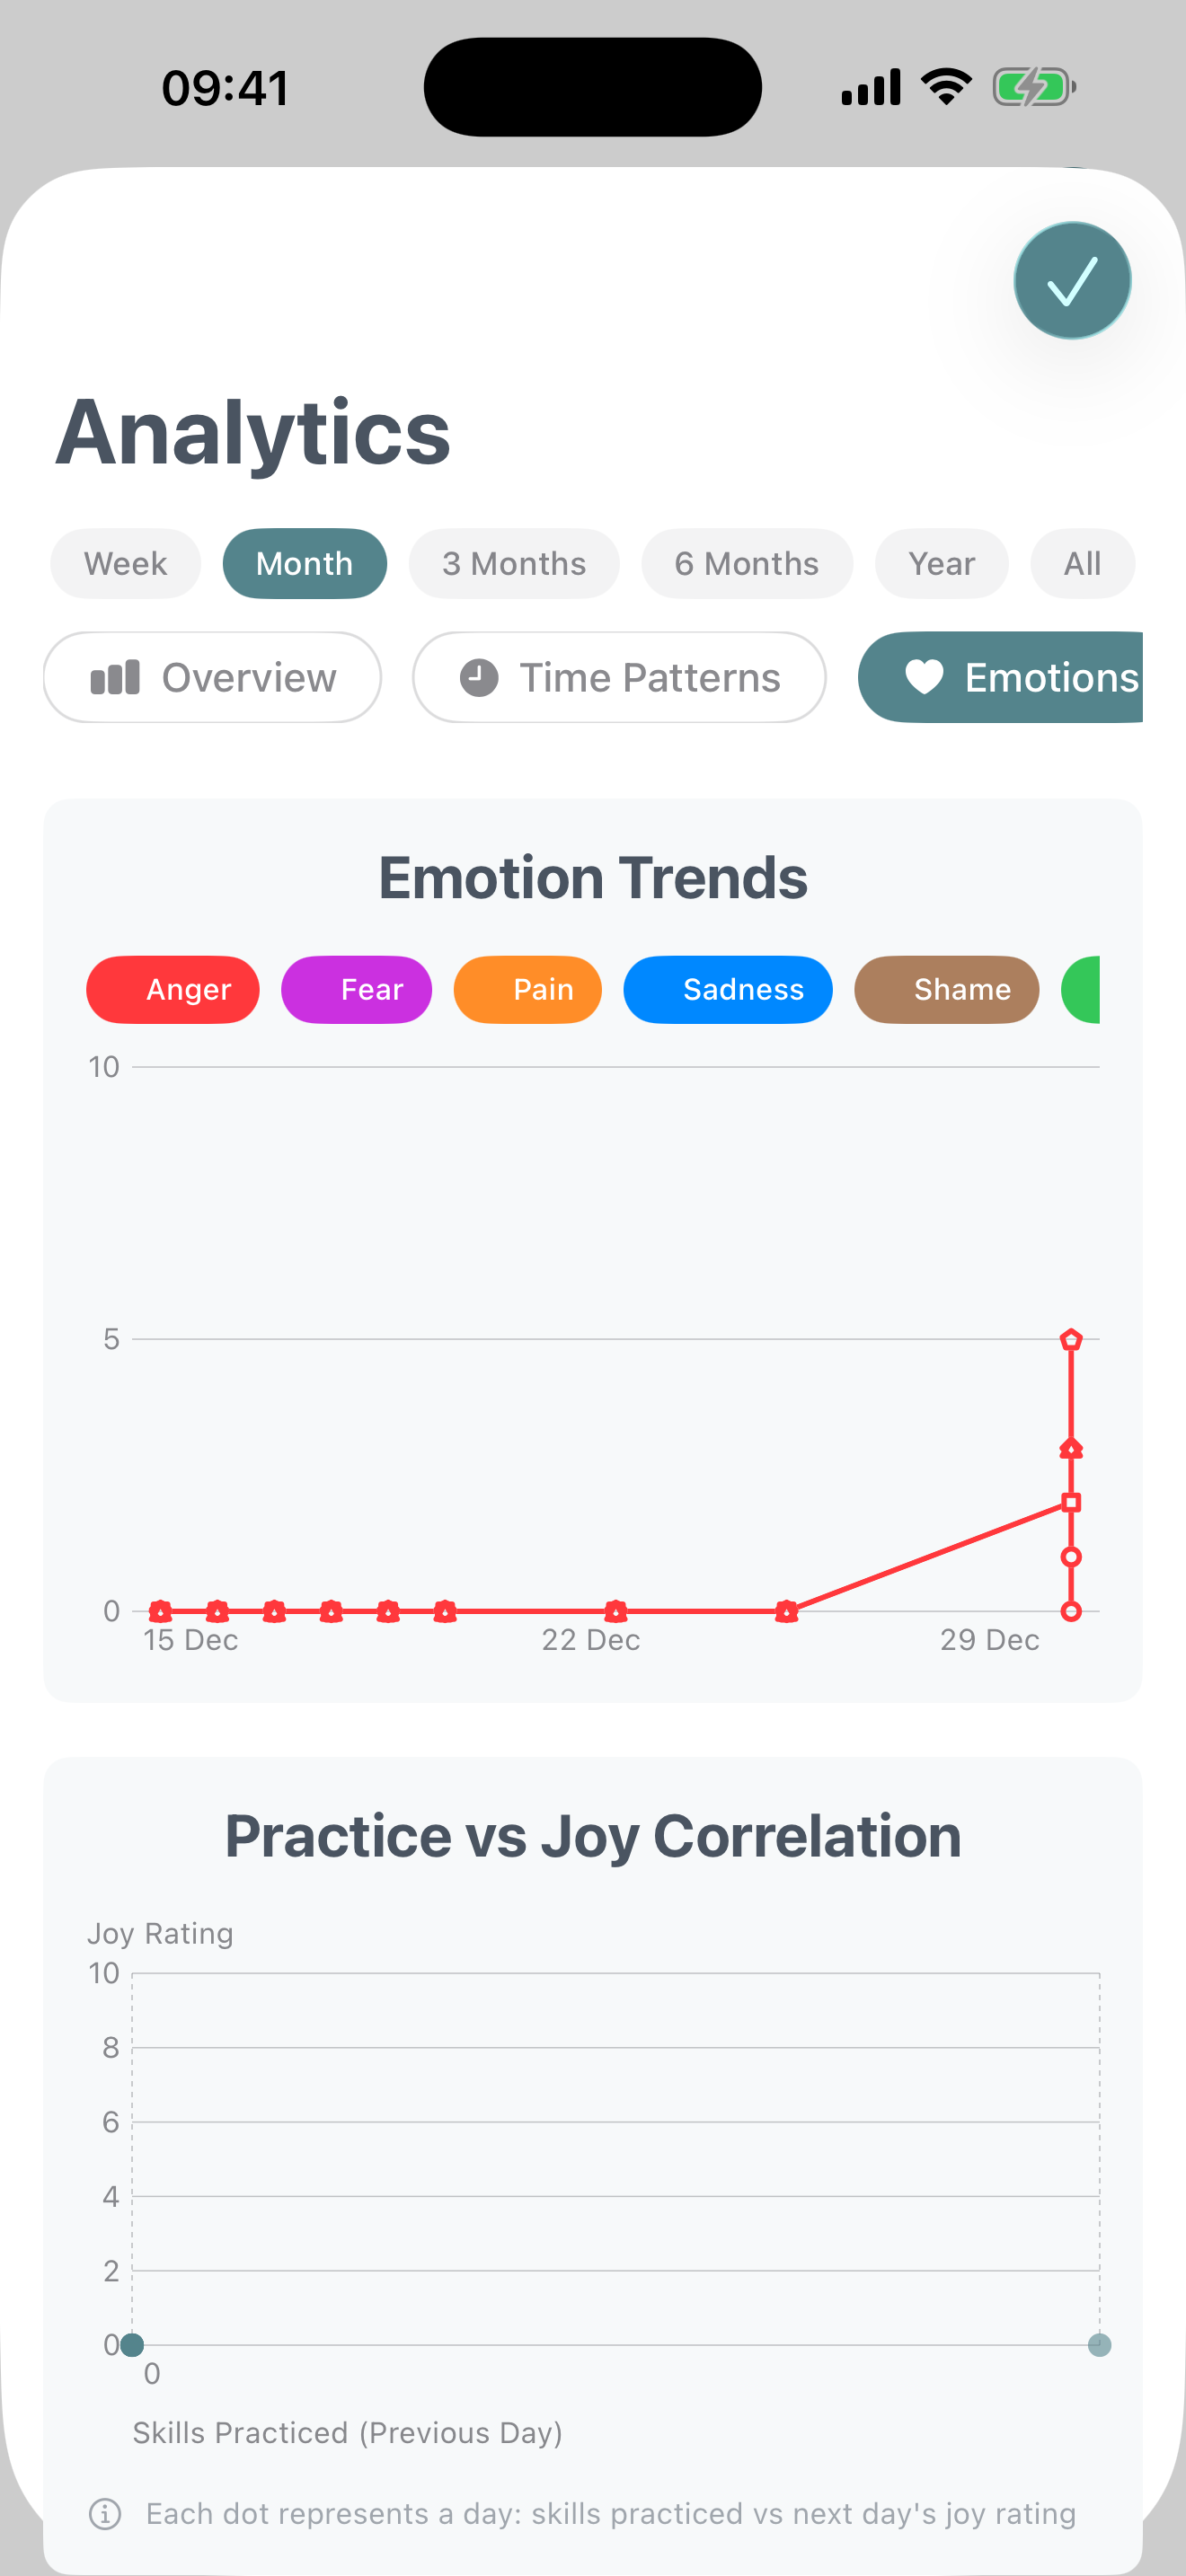
Emotions
Explore emotional patterns and their connection to skill practice (requires Diary Card data).
- Emotion Trends: Track how your reported emotions (anger, fear, pain, sadness, shame, joy) change over time
- Joy Correlation: See the relationship between skills practiced and joy levels
- Urge Tracker: Monitor patterns in urges (self-harm, suicide, substance use, therapy discontinuation)
Note About Emotion Analytics
Emotion data comes from your Diary Cards. Complete daily Diary Cards consistently to unlock rich emotional insights.
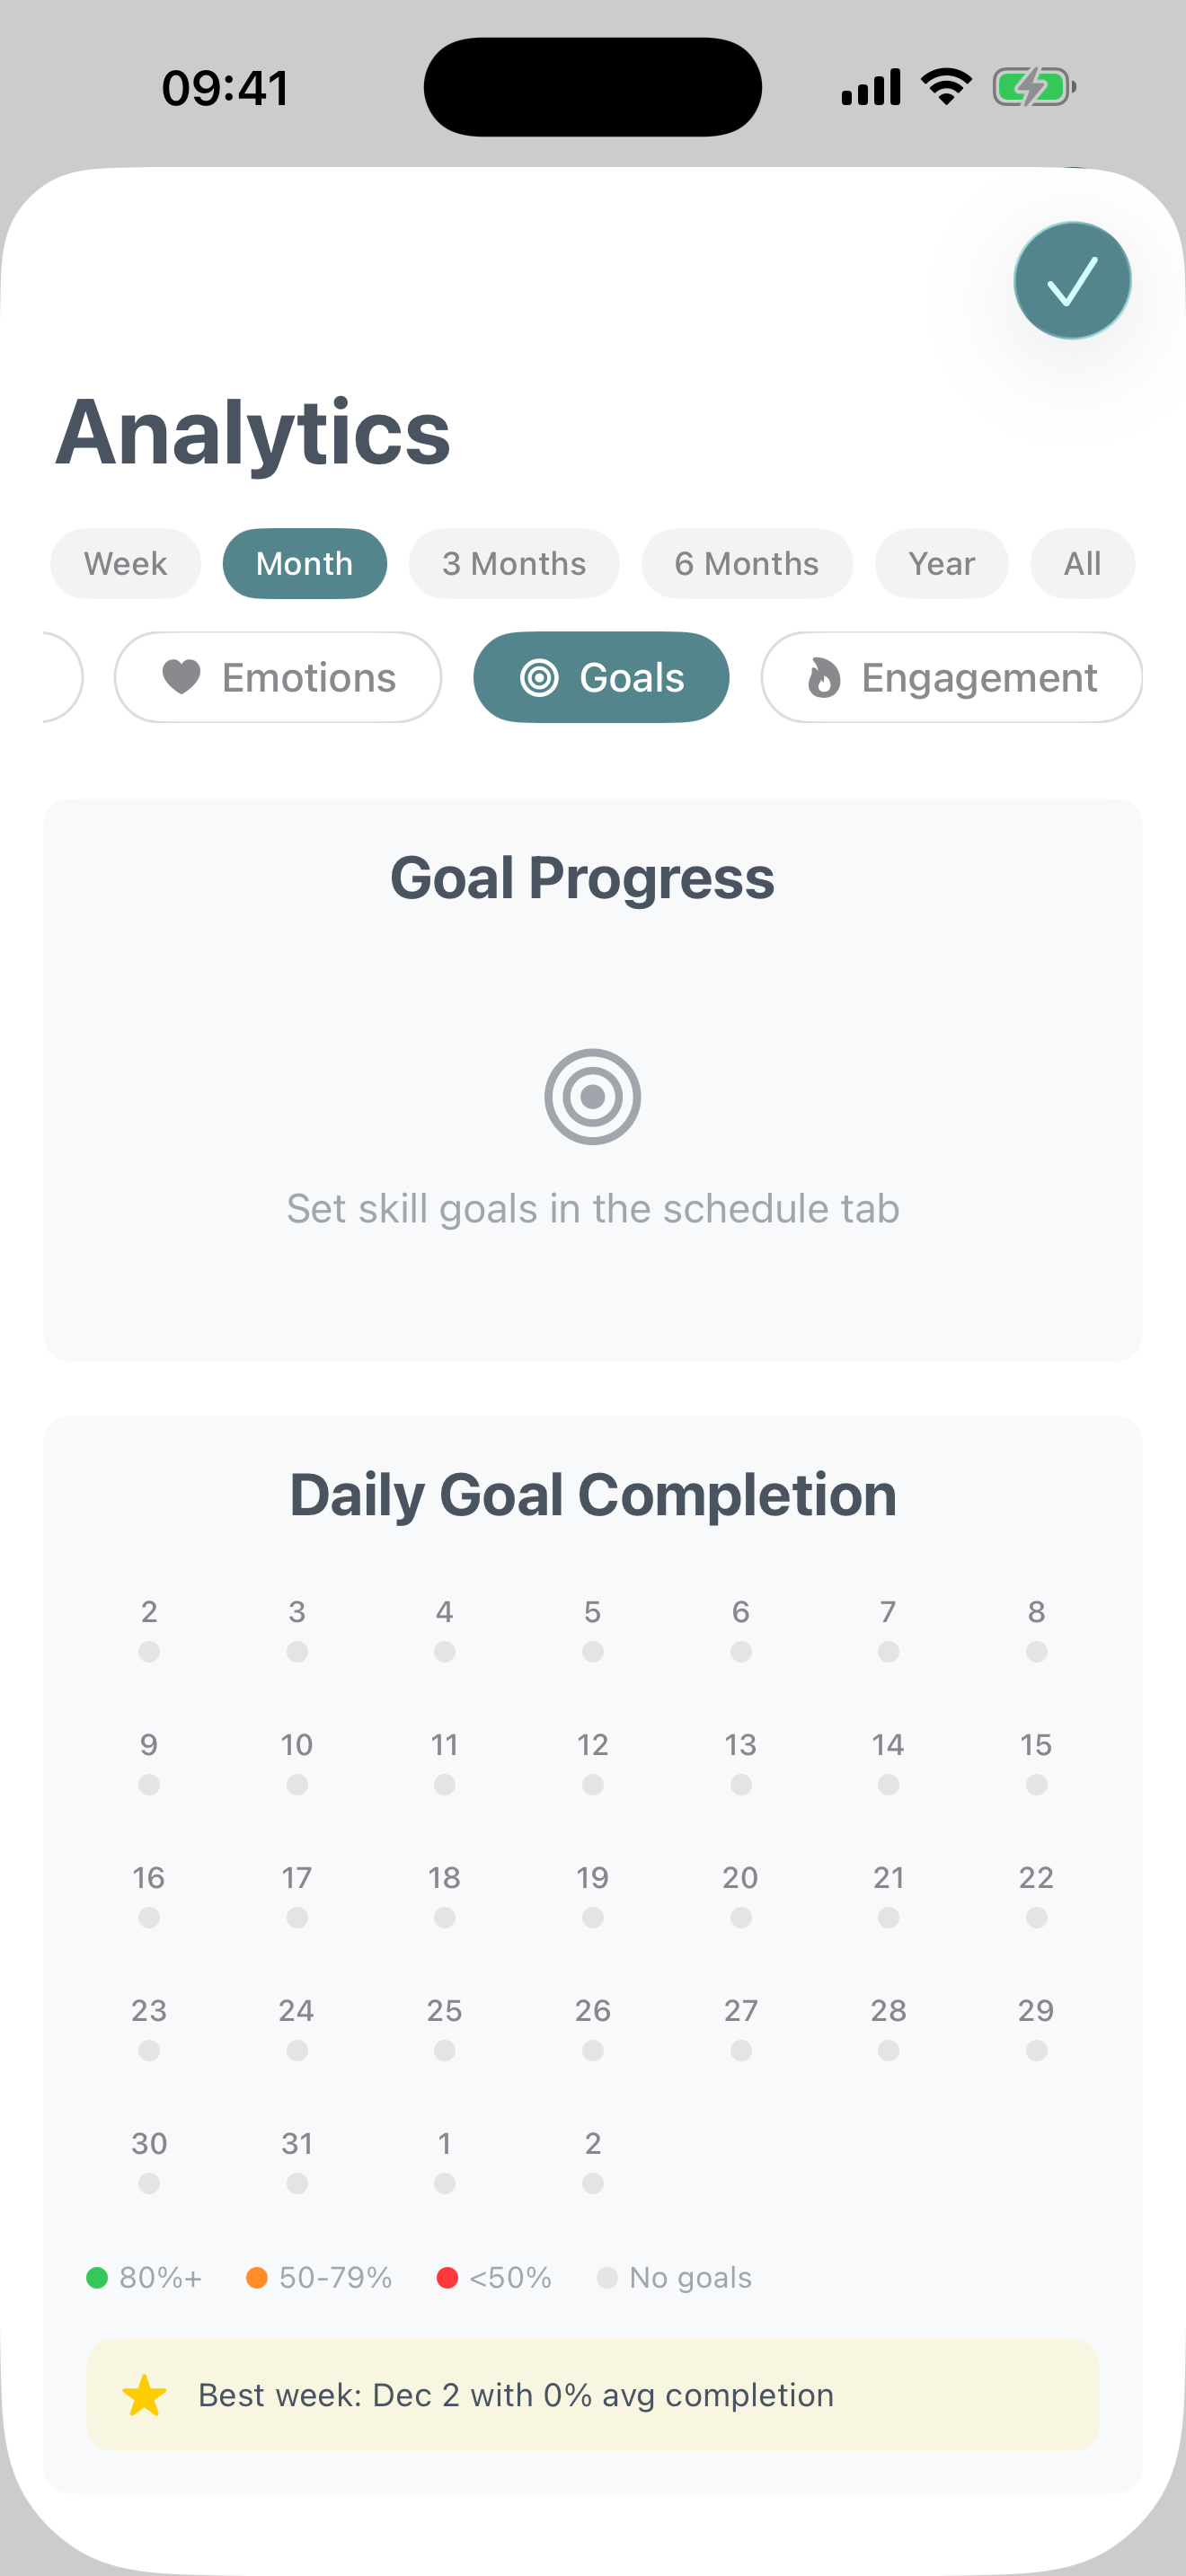
Goals
Track progress toward your practice goals and targets.
- Goal Progress Overview: See completion percentages for each skill goal you've set
- Daily Goal Grid: Visual calendar showing which days you met your goals
- Skill-Specific Tracking: Understand how close you are to weekly or monthly targets for individual skills
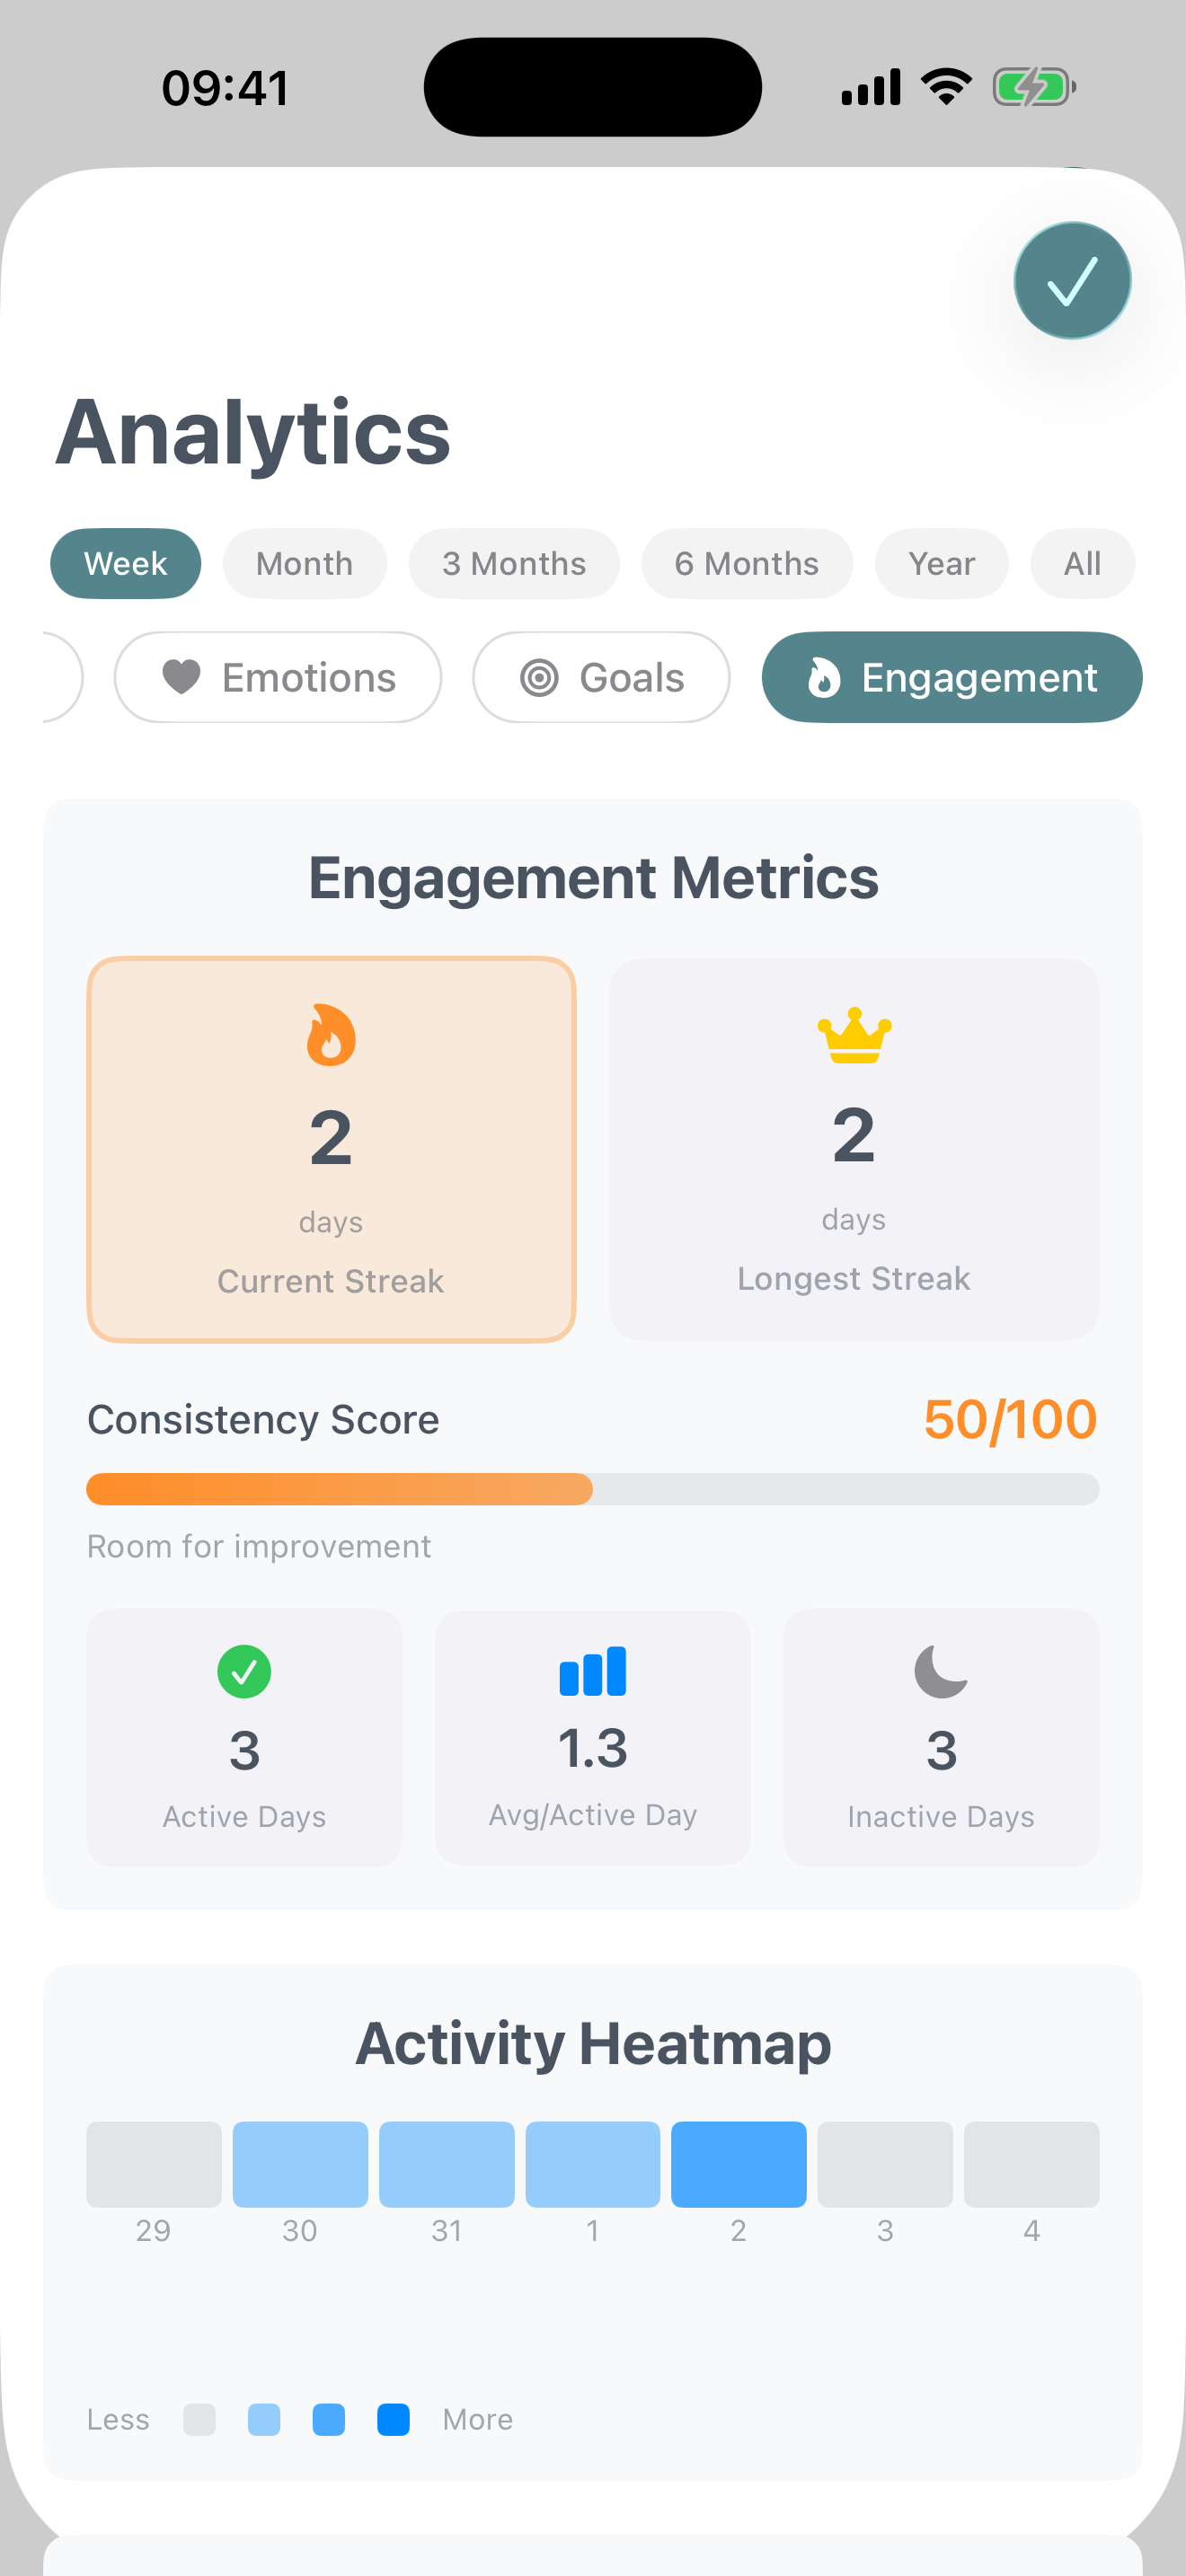
Engagement
Measure your consistency and commitment to practice.
- Engagement Metrics: Current streak, longest streak, consistency score, average skills per day
- Engagement Timeline: Heatmap showing intensity of practice each day (none, low, medium, high)
- Exercise Completions: Track how often you complete SOS exercises and other interactive features
Making the Most of Analytics
Look for Patterns
Don't just focus on totals. Notice trends like "I practice more on weekends" or "My joy increases when I use Mindfulness skills."
Balance Your Practice
Use the Category Balance chart to ensure you're not neglecting any of the four DBT skill modules.
Review Regularly
Check your analytics weekly or monthly to stay aware of your progress and adjust your practice as needed.
Share with Your Therapist
Analytics can be valuable conversation starters in therapy. Screenshot insights to discuss patterns with your provider.